Exhibit 20-7 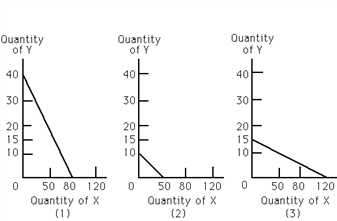
Refer to Exhibit 20-7. Which of the following graphs represents a budget constraint of a consumer whose income is $120?
A) (1)
B) (2)
C) (3)
D) (1) and (2)
E) This cannot be determined from the information provided.
Correct Answer:
Verified
Q138: If the marginal utility of X is
Q139: Exhibit 20-4 Q141: Exhibit 20-7 Q142: If the MU\P ratio for two goods Q143: Exhibit 20-6 Q144: An indifference curve shows Q146: An indifference curve shows all Q147: If Smith will give up three units Q148: Exhibit 20-7 Q149: Exhibit 20-7 Unlock this Answer For Free Now! View this answer and more for free by performing one of the following actions Scan the QR code to install the App and get 2 free unlocks Unlock quizzes for free by uploading documents![]()
![]()
![]()
A)the bundles of two
A)possible equilibrium positions![]()
![]()

