Multiple Choice
Figure 1-1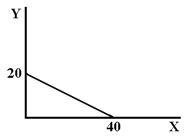
The slope of the line in Figure 1-1 is
A) 0.5.
B) 2.0.
C) −0.5.
D) −2.0.
Correct Answer:
Verified
Related Questions
Q208: A diagram is a good example of
Q210: Economic analysis and policy are made more
Q216: If an economic curve has a negative
Q218: When variable A rises by 10 units,
Q219: The beginning point of a graph (the
Q224: Which of the following mathematical expressions represents
Unlock this Answer For Free Now!
View this answer and more for free by performing one of the following actions

Scan the QR code to install the App and get 2 free unlocks

Unlock quizzes for free by uploading documents