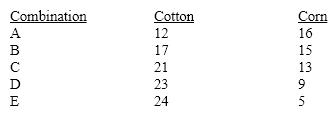
-Table 3-2 The concept of opportunity cost can be represented graphically by the
A) area inside the production possibilities frontier.
B) slope of the production possibilities frontier.
C) vertical distance from the horizontal axis to the production possibilities frontier.
D) horizontal distance from the vertical axis to the production possibilities frontier.
E) sum of the horizontal and vertical distances to the production possibilities frontier.
Correct Answer:
Verified
Q166: The shape of the production possibilities frontier
Q169: The opportunity cost of increased production of
Q174: How are the slope of a production
Q176: The production possibilities curve illustrates the basic
Q178: For a given production possibilities frontier, which
Q179: If production involves constant opportunity cost, the
Q180: All of the points inside a production
Q183: Increasing opportunity cost tends to occur if
A)management
Q192: The statement "Resources employed in producing X
Q195: The concavity or bowed-out shape of the
Unlock this Answer For Free Now!
View this answer and more for free by performing one of the following actions

Scan the QR code to install the App and get 2 free unlocks

Unlock quizzes for free by uploading documents