Multiple Choice
Figure 3-5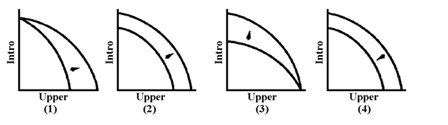
At present, faculty in the Economics Department teach introductory and upper-level courses. Which graph in Figure 3-5 represents the change in the production possibilities of the Economics Department after a policy of using graduate students in addition to faculty to teach introductory sections was implemented?
A) 1
B) 2
C) 3
D) 4
Correct Answer:
Verified
Related Questions
Q171: Which principle states that as the production
Q184: A typical economy produces thousands of different

