Multiple Choice
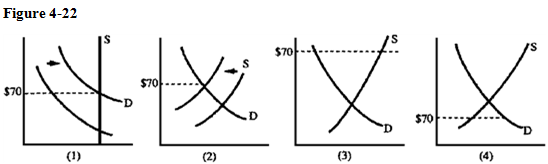
Falling oil prices meant that consumers in Libya could afford fewer imported goods. The Libyan government imposed controls to limit imports of cigarettes. At one point, the market price of a carton of cigarettes rose to $70. Which graph in Figure 4-22 best depicts this situation?
A) 1
B) 2
C) 3
D) 4
Correct Answer:
Verified
Related Questions
Q241: If the supply curve for housing has
Q246: Suppose that in a free market, 2,000
Q254: Q256: Q257: Price ceilings frequently lead to Q258: Normally, when a governmental price control affects Unlock this Answer For Free Now! View this answer and more for free by performing one of the following actions Scan the QR code to install the App and get 2 free unlocks Unlock quizzes for free by uploading documents![]()
![]()
A)an accumulation of

