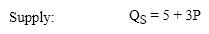
The following are the equations for the supply and demand curves in the market for weezils: 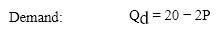
 where Q d is the quantity demanded, Q s is the quantity supplied, and P is the price per weezil in dollars.
Refer to Exhibit 4-1. According to the data given, when the market is in Equilibrium, how many weezils are sold?
A) 3
B) 5
C) 11
D) 14
Correct Answer:
Verified
Q244: Relative to the prices that would be
Q257: Price ceilings frequently lead to
A)an accumulation of
Q260: Ticket "scalping" is an example of
A)experimental economics.
B)the
Q264: The following are the equations for the
Q271: Which of the following is an example
Q272: The U.S.government restricts the production of peanuts
Q276: Why do price ceilings tend to cause
Unlock this Answer For Free Now!
View this answer and more for free by performing one of the following actions

Scan the QR code to install the App and get 2 free unlocks

Unlock quizzes for free by uploading documents