Figure 6-8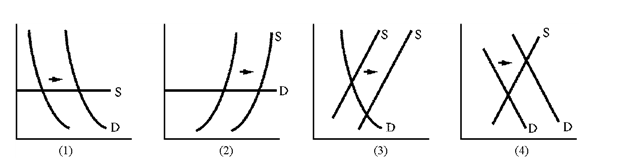
Libya sold more crude oil in 1985 than it sold five years earlier, but revenues were 17 percent less. Which graph in Figure 6-8 is consistent with this set of facts?
A) 1
B) 2
C) 3
D) 4
Correct Answer:
Verified
Q161: A recent study on enrollment at a
Q163: If, as price increases by 10 percent,
Q164: Figure 6-7 Q165: Big Alice Ice Cream Parlor reduced its Q166: Compared to the demand for coffee, the Q167: Suppose that Carol owns a property with Q171: Julia knows that the price elasticity of Q171: Suppose that the supply of insulin is Q175: If the marginal cost of producing vanity Q177: John's Bait Shop was surprised to learn![]()
Unlock this Answer For Free Now!
View this answer and more for free by performing one of the following actions

Scan the QR code to install the App and get 2 free unlocks

Unlock quizzes for free by uploading documents