Figure 6-9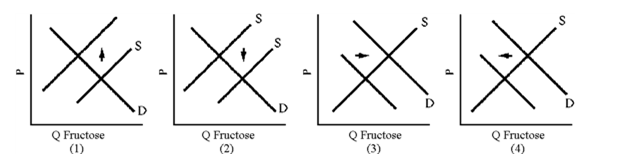
In 1983, government price supports raised the price of sugar above its equilibrium value. Which graph in Figure 6-9 illustrates the impact of sugar price supports on the sugar substitute fructose?
A) 1
B) 2
C) 3
D) 4
Correct Answer:
Verified
Q169: A 10 percent increase in the cost
Q181: The price of an airline ticket rises
Q182: Which of the following is more likely
Q185: A study of New York City (NYC)
Q186: If both matches and automobile prices increase
Q190: Which of the following goods will have
Q191: Which of the following goods will have
Q193: The price elasticity of new automobile purchases
Q195: Certain goods are related such that an
Q200: A decrease in the price of rice
Unlock this Answer For Free Now!
View this answer and more for free by performing one of the following actions

Scan the QR code to install the App and get 2 free unlocks

Unlock quizzes for free by uploading documents