Figure 7-4 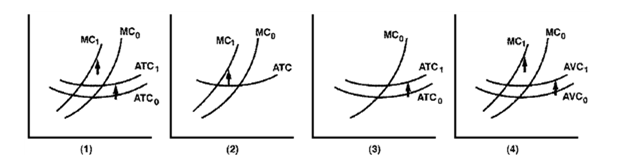
Following a rash of airplane bombs, the airlines have been forced to increase security at a cost of $30 million per year. The number of inspectors and machines does not vary with the number of passengers; the airlines must have sufficient staff available to handle the full-capacity load. Which graph in Figure 7-4 best illustrates the impact of the security expenditures?
A) 1
B) 2
C) 3
D) 4
Correct Answer:
Verified
Q84: Where marginal cost is less than average
Q144: For most firms, if the marginal cost
Q146: Figure 7-3 Q147: A firm produces 2,000 high-quality bicycles per Q148: A factory produces 1,000 radios a year, Q149: Table 7-4 Q151: Table 7-4 Q153: Renee runs an accounting firm that does Q156: Table 7-4 Q159: Greg's Restaurant specializes in cheeseburger and produces Unlock this Answer For Free Now! View this answer and more for free by performing one of the following actions Scan the QR code to install the App and get 2 free unlocks Unlock quizzes for free by uploading documents![]()
![]()
![]()
![]()

