Multiple Choice
Figure 7-8 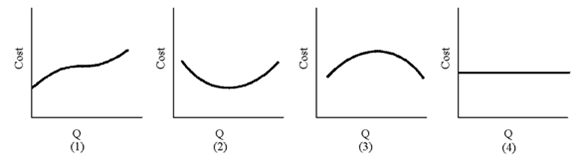
Of the graphs in Figure 7-8, which diagram is most likely to be the marginal cost?
A) 1
B) 2
C) 3
D) 4
Correct Answer:
Verified
Related Questions
Q149: Figure 7-4 Q161: Which of the following observations is true?![]()
A)TFC
Figure 7-8
Of the graphs in Figure 7-8, which diagram is most likely to be the marginal cost?
A) 1
B) 2
C) 3
D) 4
Correct Answer:
Verified
Q149: Figure 7-4 Q161: Which of the following observations is true?![]()
A)TFC

