Figure 8-3 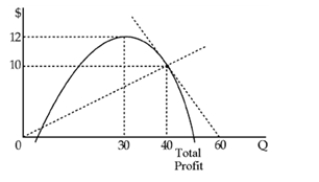
-If a company plots its total profit curve, it would show
A) that the curve has a negative slope over the entire range of output.
B) that the slope of the curve is negative, then zero and then becomes positive as output increases.
C) that the slope of the curve is positive, then zero and then becomes negative as output increases.
D) that slope is a constant at a value of one.
Correct Answer:
Verified
Q134: A firm can always increase its output
Q135: Average cost
A)is always larger than marginal cost.
B)declines
Q136: Average cost
A)increases and eventually begins to decrease.
B)is
Q137: Joe and Ed go to a diner
Q138: Figure 8-3 Q140: Average revenue is equal to Q141: If a firm finds itself at an Q142: To find its profit-maximizing output level, a Q143: The typical total profit graphical presentation is Q144: Figure 8-5 ![]()
A)TR/Q.
B)(P × Q)/P.
C)TR![]()
Unlock this Answer For Free Now!
View this answer and more for free by performing one of the following actions

Scan the QR code to install the App and get 2 free unlocks

Unlock quizzes for free by uploading documents