Figure 10-2 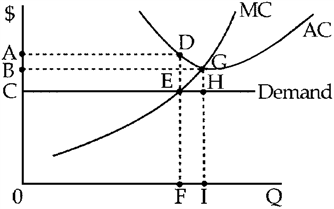
Figure 10-2 shows demand and short-run cost curves for a perfectly competitive firm. At its profit-maximizing level of output, the firm's short-run TC is represented by area
A) ADFO.
B) BGHC.
C) BGIO.
D) ADGIO.
Correct Answer:
Verified
Q103: Figure 10-1 Q104: Figure 10-1 Q105: Exhibit 10-1 A perfectly competitive producer has Q106: Figure 10-1 Q106: The perfectly competitive firm has no influence Q109: For a perfectly competitive firm in the Q110: The firm whose short-run cost curves are Q118: A firm in short-run equilibrium always earns Q119: In short-run equilibrium, a perfectly competitive firm Q120: Which of the following observations is not Unlock this Answer For Free Now! View this answer and more for free by performing one of the following actions Scan the QR code to install the App and get 2 free unlocks Unlock quizzes for free by uploading documents![]()
![]()
![]()
A)may

