Figure 11-8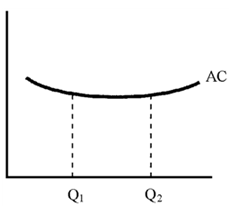
Consider the average cost curve shown in Figure 11-8, for the production of cleaning. If the firm serves the entire market and sells Q1 units. Based upon this information, the firm is experiencing
A) constant returns to scale .
B) increasing returns to scale.
C) decreasing returns to scale.
D) externalities.
Correct Answer:
Verified
Q169: Figure 11-5 Q177: Figure 11-7 Q178: Figure 11-7 Q179: Monopoly as a market structure leads to Q185: Figure 11-9 Q187: Compared to perfect competition, a monopoly in Q188: Under monopoly Unlock this Answer For Free Now! View this answer and more for free by performing one of the following actions Scan the QR code to install the App and get 2 free unlocks Unlock quizzes for free by uploading documents![]()
![]()
![]()
A)prices![]()
A)too small a share of society's

