Multiple Choice
Figure 13-2
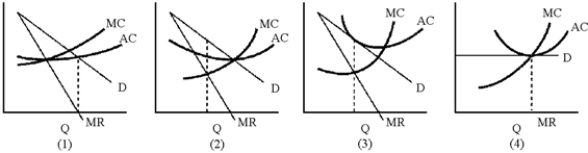
-In Figure 13-2, which of the graphs represents a firm that is a sales revenue maximizer?
A) 1
B) 2
C) 3
D) 4
Correct Answer:
Verified
Related Questions
Q109: Figure 13-1 Q110: In the short run, firms in monopolistically Q111: In the long run, the prices charged Q112: Unlike a perfectly competitive firm, a monopolistically
![]()
Unlock this Answer For Free Now!
View this answer and more for free by performing one of the following actions

Scan the QR code to install the App and get 2 free unlocks

Unlock quizzes for free by uploading documents