Multiple Choice
Figure 34-3 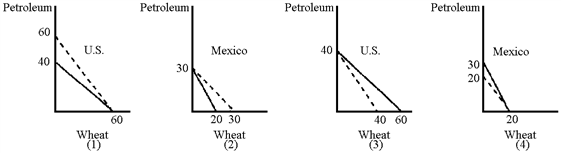
In Figure 34-3, the solid lines represent the respective production possibilities curves for the United States and Mexico. Which graphs show the correct consumption possibilities curves (dashed lines) after an agreement is reached to trade 1 unit of wheat for 1 unit of petroleum?
A) (1) and (4)
B) (1) and (2)
C) (2) and (3)
D) (3) and (4)
Correct Answer:
Verified
Related Questions

