Figure 34-7 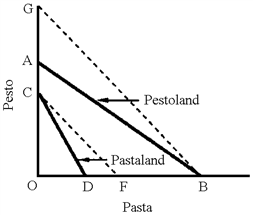
In Figure 34-7, AB represents the production possibilities of Pestoland and CD that of Pastaland. In this graph, Pestoland has a comparative advantage in
A) pasta because OA\OB
B) pesto because OA\OB
C) pasta because OA\OB > OC\OD.
D) pesto because OA\OB > OC\OD.
Correct Answer:
Verified
Q123: Using graphs to illustrate the concepts, absolute
Q129: Figure 34-8 Q132: Table 34-4 Q132: The supply-demand mechanism will bring an international Q135: Figure 34-7 Q136: Table 34-4 Q137: Figure 34-7 Q139: The effect of opening trade between countries Q139: Figure 34-7 Q140: If the production possibilities curves of two Unlock this Answer For Free Now! View this answer and more for free by performing one of the following actions Scan the QR code to install the App and get 2 free unlocks Unlock quizzes for free by uploading documents![]()
![]()
![]()
![]()
![]()
![]()

