Multiple Choice
Figure 3-15 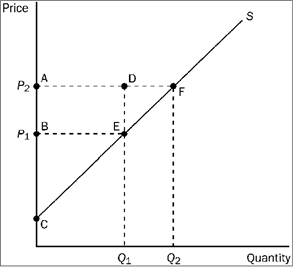
Refer to Figure 3-15. Which area represents the increase in producer surplus when the price rises from P 1 to P 2 due to new producers entering the market?
A) BCE
B) ACF
C) DEF
D) AFEB
Correct Answer:
Verified
Related Questions
Q307: Use the figure below to answer the
Q308: Figure 3-10 Q309: Figure 3-15 Q310: Figure 3-16 Q311: Use the figure below to answer the Q313: Use the figure below to answer the Q314: Use the figure below to answer the Q315: Figure 3-12 Q316: Use the figure below to answer the Q317: Figure 3-15 Unlock this Answer For Free Now! View this answer and more for free by performing one of the following actions Scan the QR code to install the App and get 2 free unlocks Unlock quizzes for free by uploading documents![]()
![]()
![]()
![]()
![]()

