Multiple Choice
Figure 3-18 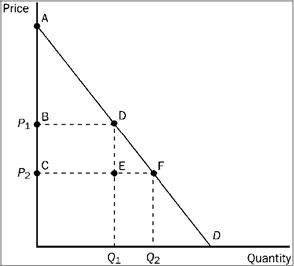
Refer to Figure 3-18. When the price falls from P 1 to P 2, which area represents the increase in consumer surplus to existing buyers?
A) ABD
B) ACF
C) BCED
D) DEF
Correct Answer:
Verified
Related Questions
Figure 3-18
Refer to Figure 3-18. When the price falls from P 1 to P 2, which area represents the increase in consumer surplus to existing buyers?
A) ABD
B) ACF
C) BCED
D) DEF
Correct Answer:
Verified

