Multiple Choice
Figure 3-22 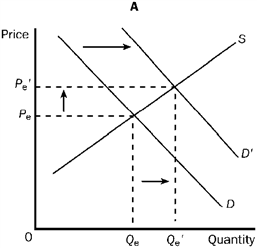
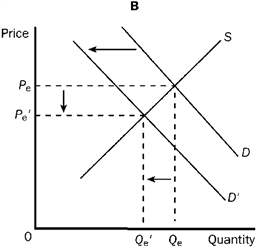
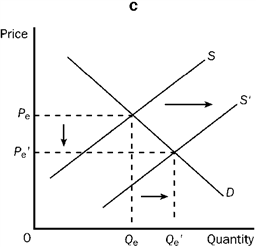
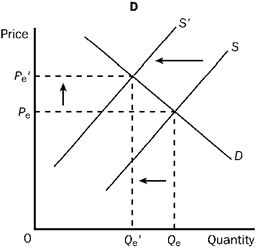
Refer to Figure 3-22. Which of the four graphs represents the market for peanut butter after a major hurricane hits the peanut-growing south?
A) A
B) B
C) C
D) D
Correct Answer:
Verified
Related Questions
Q348: If cigars and cigarettes are substitute goods,
Q351: Which of the following would most likely
Q356: If the price of tickets to the
Q357: Which of the following would cause the
Q366: All things constant, a decrease in bus,
Q368: John advertises his used car for $3,000
Q379: "If gasoline were taxed, the price of

