Use the figure below to answer the following question(s) .
Figure 4-8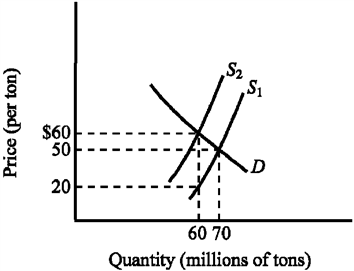
Refer to Figure 4-8. The supply curve S 1 and the demand curve D indicate initial conditions in the market for soft coal. A $40-per-ton tax on soft coal is levied, shifting the supply curve from S 1 to S 2. Imposing the tax increases the equilibrium price of soft coal from
A) $20 to $60 per ton.
B) $20 to $50 per ton.
C) $50 to $60 per ton.
D) $50 to $90 per ton.
Correct Answer:
Verified
Q207: Figure 4-1 Q208: Use the figure below to answer the Q209: Use the figure below to answer the Q210: Use the figure below to answer the Q211: Figure 4-5 Q213: Use the figure below illustrating the impact Q214: Use the figure below illustrating the impact Q215: Use the figure below to answer the Q216: Figure 4-3 Q217: Use the figure below to answer the Unlock this Answer For Free Now! View this answer and more for free by performing one of the following actions Scan the QR code to install the App and get 2 free unlocks Unlock quizzes for free by uploading documents![]()
![]()
![]()

