Use the figure below to answer the following question(s) .
Figure 4-10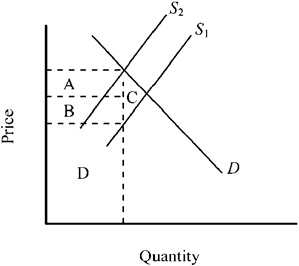
Refer to Figure 4-10. The accompanying graph shows the market for a good before and after an excise tax is imposed. The total tax revenue generated is indicated by
A) area A + area B + area D.
B) area A + area B + area C.
C) area A + area B.
D) area D only.
Correct Answer:
Verified
Q217: Use the figure below to answer the
Q218: Use the figure below illustrating the impact
Q219: Use the figure below to answer the
Q220: Use the figure below to answer the
Q221: Use the figure below to answer the
Q223: Use the figure below to answer the
Unlock this Answer For Free Now!
View this answer and more for free by performing one of the following actions

Scan the QR code to install the App and get 2 free unlocks

Unlock quizzes for free by uploading documents