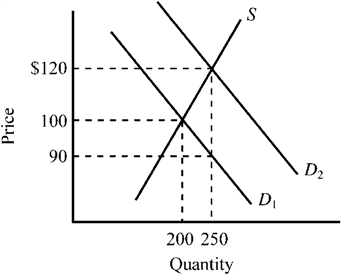
Use the figure below to answer the following question(s) .
Figure 4-12
Refer to Figure 4-12. The supply curve S and the demand curve D 1 indicate initial conditions in the market for college textbooks. A new government program is implemented that grants students a $30 per textbook subsidy on every textbook they purchase, shifting the demand curve from D 1 to D 2. Which of the following is true for this subsidy given the information provided in the exhibit?
A) Textbook buyers will receive an actual benefit of $10 from the subsidy, while textbook sellers will receive an actual benefit of $20 from the subsidy.
B) Textbook buyers will receive an actual benefit of $20 from the subsidy, while textbook sellers will receive an actual benefit of $10 from the subsidy.
C) Textbook buyers will receive the full $30 benefit from the subsidy.
D) Textbook sellers will receive the full $30 benefit from the subsidy.
Correct Answer:
Verified
Q227: Use the figure below to answer the
Q228: Use the figure below to answer the
Q229: Use the figure below to answer the
Q230: Use the figure below to answer the
Q231: Figure 4-17 Q233: Use the figure below to answer the Q234: Use the figure below to answer the Q235: Figure 4-17 Q236: Use the figure below to answer the Q237: Figure 4-17 Unlock this Answer For Free Now! View this answer and more for free by performing one of the following actions Scan the QR code to install the App and get 2 free unlocks Unlock quizzes for free by uploading documents![]()
![]()
![]()

