Use the figure below to answer the following question(s) .
Figure 6-1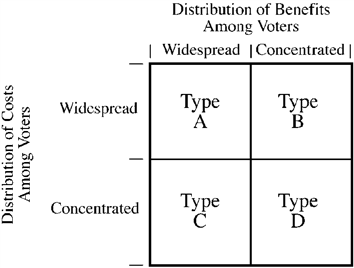
Figure 6-1 illustrates the four possibilities of the distribution of costs and benefits among voters for a government project. For which type would the government most likely fail to undertake many projects that would be considered efficient or productive (in other words, do too few of them relative to economic efficiency) ?
A) type A
B) type B
C) type C
D) type D
Correct Answer:
Verified
Q73: Which of the following factors weakens the
Q96: Which of the following is most likely
Q128: Use the figure below to answer the
Q129: Use the figure below to answer the
Q131: Use the figure below to answer the
Q132: Economic theory leads us to expect that
Q134: Scenario 6-1 The quotation below relates to
Q135: Use the figure below to answer the
Q136: Giving local governments more power is less
Q137: Use the figure below to answer the
Unlock this Answer For Free Now!
View this answer and more for free by performing one of the following actions

Scan the QR code to install the App and get 2 free unlocks

Unlock quizzes for free by uploading documents