Figure 9-12 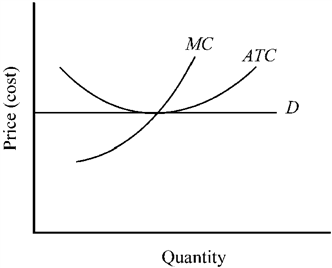
Figure 9-12 illustrates a
A) competitive price-taker firm that is earning economic profit.
B) competitive price-taker firm that is only able to break even when it is maximizing economic profit.
C) firm that should shut down immediately.
D) competitive price-taker firm that is making economic losses.
Correct Answer:
Verified
Q194: The graph below depicts the cost structure
Q195: Figure 9-14 Q196: The graph below depicts the cost structure Q197: Use the figure to answer the following Q198: Use the figure to answer the following![]()
Unlock this Answer For Free Now!
View this answer and more for free by performing one of the following actions

Scan the QR code to install the App and get 2 free unlocks

Unlock quizzes for free by uploading documents