Which of the following best describes the series of events shown in the figure? The original conditions prior to the change are shown by D 0 and S 0 (point A) , and S LR is the market long-run supply curve.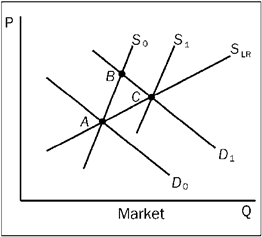
A) an increase in demand and an expansion in the number of firms in an increasing cost industry
B) an increase in demand and an expansion in the number of firms in a decreasing cost industry
C) an increase in demand and an expansion in the number of firms in a constant cost industry
D) none of the above
Correct Answer:
Verified
Q167: The short-run market supply curve in a
Q172: In the short run, a profit-maximizing price
Q179: When an economist states that a firm
Q242: The dynamic process of competition
A) provides profit-seeking
Q468: The schedule of total cost for a
Q470: The figure depicts a firm in a
Q471: The figure shows a representative firm in
Q475: The figure shows a representative firm in
Q476: The figure depicts a firm in a
Q478: The figure depicts a firm in a
Unlock this Answer For Free Now!
View this answer and more for free by performing one of the following actions

Scan the QR code to install the App and get 2 free unlocks

Unlock quizzes for free by uploading documents