Figure 10-8 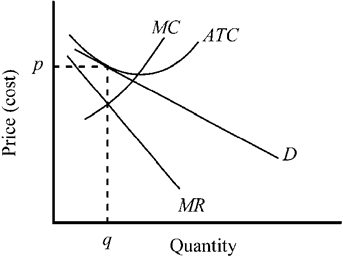
Figure 10-8 presents the demand, marginal revenue, and cost curves for a typical firm in a market. This figure illustrates
A) short-run equilibrium in a competitive price-taker market.
B) long-run equilibrium in a competitive price-taker market.
C) short-run equilibrium in a competitive price-searcher market.
D) long-run equilibrium in a competitive price-searcher market.
Correct Answer:
Verified
Q107: Which of the following is true of
Q149: Use the figure to answer the following
Q150: Use the figure to answer the following
Q151: Use the figure to answer the following
Q152: Use the figure to answer the following
Q153: Use the figure to answer the following
Q156: Use the figure to answer the following
Q157: Use the figure to answer the following
Q158: Use the figure to answer the following
Q159: Figure 10-7 ![]()
Unlock this Answer For Free Now!
View this answer and more for free by performing one of the following actions

Scan the QR code to install the App and get 2 free unlocks

Unlock quizzes for free by uploading documents