The figure below illustrates the cost and revenue structure for a monopoly firm.
Figure 11-17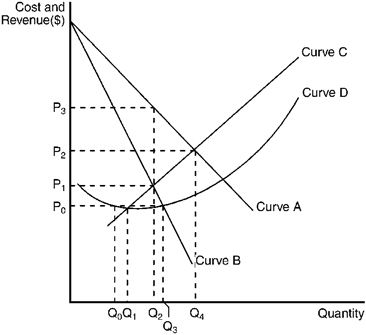
Refer to Figure 11-17. The demand curve for a monopoly firm is depicted by curve
A) A.
B) B.
C) C.
D) D.
Correct Answer:
Verified
Q179: Use the figure to answer the following
Q180: Use the figure to answer the following
Q181: Figure 11-18 Q182: Use the figure to answer the following Q183: Figure 11-16 Q185: The figure below illustrates the cost and Q186: Figure 11-19 Q187: Use the figure to answer the following Q188: Figure 11-18 Q189: Figure 11-18 Unlock this Answer For Free Now! View this answer and more for free by performing one of the following actions Scan the QR code to install the App and get 2 free unlocks Unlock quizzes for free by uploading documents![]()
![]()
![]()
![]()
![]()

