Multiple Choice
The figure below illustrates the cost and revenue structure for a monopoly firm.
Figure 11-17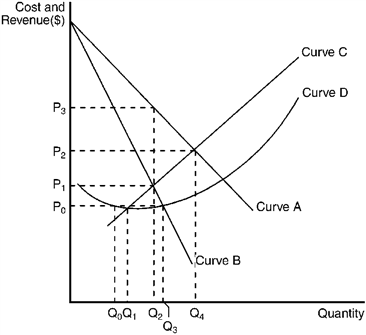
Refer to Figure 11-17. The average total cost curve for a monopoly firm is depicted by curve
A) A.
B) B.
C) C.
D) D.
Correct Answer:
Verified
Related Questions
Q191: The figure below illustrates the cost and
Q192: The figure below depicts the demand, marginal
Q193: The figure below illustrates the cost and
Q194: Use the figure to answer the following
Q195: Use the figure to answer the following

