Figure 15-4 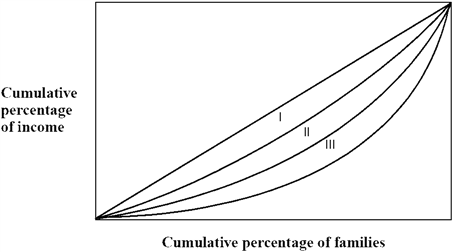
Figure 15-4 shows the Lorenz Curve for three countries, I, II, and III. Of the three countries shown,
A) country III has the most unequal income distribution.
B) country II has the most unequal income distribution.
C) country I has the most unequal income distribution.
D) country III has the most equal income distribution.
E) country II has a more equal income distribution than Country I.
Correct Answer:
Verified
Q86: Because the United States has a progressive
Q87: Figure 15-3 Q88: Figure 15-4 Q89: Figure 15-1 Q90: Figure 15-2 Q92: Figure 15-3 Q93: Figure 15-2 Q94: When deciding whether to classify a family Q95: (I) High implicit marginal tax rates reduce Q96: Figure 15-3 Unlock this Answer For Free Now! View this answer and more for free by performing one of the following actions Scan the QR code to install the App and get 2 free unlocks Unlock quizzes for free by uploading documents![]()
![]()
![]()
![]()
![]()
![]()
![]()

