Multiple Choice
Exhibit 2-14 Production possibilities curve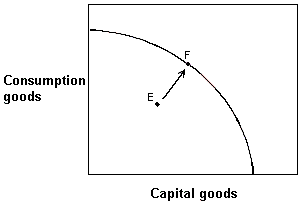
In Exhibit 2-14, which of the following explains this economy's movement from point E to point F?
A) The rate of unemployment in this economy would have increased.
B) Consumption goods production has increased, but capital goods production has decreased.
C) The economy has decreased unemployment, but some degree of unemployment still exists
D) The economy has achieved full employment.
Correct Answer:
Verified
Related Questions
Q69: Exhibit 2-16 Production possibilities curve Q70: Exhibit 2-15 Production possibilities curve Q71: The law of increasing costs indicates that Q72: ![]()
![]()

