Exhibit 2-18 Production possibilities curves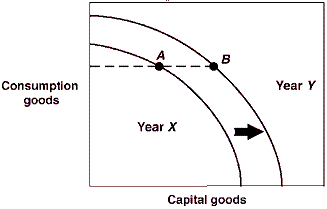
-In Exhibit 2-18, a country is located at point A on its Year X production possibilities curve. In Year Y this same country is located at point B on its Year Y production possibilities curve. Which of the following could have brought about this outward shift in production possibilities curves?
A) More efficient production in Year X.
B) A natural disaster in Year X which leads to a destruction of resources.
C) Higher unemployment in Year X.
D) An advance in technology occurred in Year X.
Correct Answer:
Verified
Q81: An analysis of production possibilities curves indicates
Q82: Economic growth may be represented by a(n):
A)
Q83: Compare two economies A and B that
Q85: Exhibit 2-19 Production possibilities curves Q87: What can a nation do to increase Q88: Adding more resources causes: Q89: If an economy keeps increasing its capital Q90: Technological innovations will cause: Q91: Exhibit 2-15 Production possibilities curve Q145: With time, which one of the following![]()
A) downward movement along
A) the production possibilities![]()
Unlock this Answer For Free Now!
View this answer and more for free by performing one of the following actions

Scan the QR code to install the App and get 2 free unlocks

Unlock quizzes for free by uploading documents