Exhibit 2-18 Production possibilities curves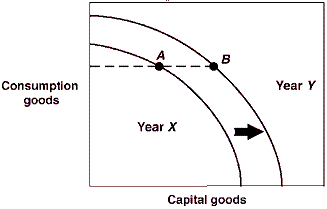
-In Exhibit 2-18, the production possibilities curves for a country are shown for the years Year X and Year Y. Suppose this country was located at point A in Year X and point B in Year Y. This economy:
A) is worse off in Year Y than in Year X.
B) has stagnated production in this two year period.
C) is more efficient in Year Y than in Year X.
D) has shown growth between these two years.
Correct Answer:
Verified
Q89: If an economy keeps increasing its capital
Q90: Technological innovations will cause:
A) the production possibilities
Q91: Exhibit 2-15 Production possibilities curve Q92: Exhibit 2-17 Production possibilities curve Q93: The production possibilities curve for the nation Q95: Exhibit 2-11 Production possibilities curves Q96: The production possibilities curve for the nation Q97: Which of the following causes the production Q98: Which would be least likely to cause Q99: Exhibit 2-18 Production possibilities curves Unlock this Answer For Free Now! View this answer and more for free by performing one of the following actions Scan the QR code to install the App and get 2 free unlocks Unlock quizzes for free by uploading documents![]()
![]()
![]()
![]()

