Exhibit 3-3 Demand curves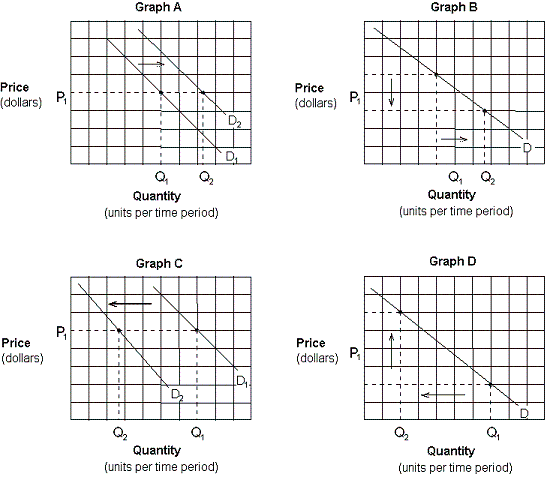
-Which of the graphs in Exhibit 3-3 depicts the effect of a decrease in the price of domestic cars on the demand for foreign cars?
A) Graph A.
B) Graph B.
C) Graph C.
D) Graph D.
Correct Answer:
Verified
Q29: A movement along the demand curve for
Q30: Other things being equal, the effects of
Q31: The horizontal summation of all individual demands
Q32: Other things being equal, the effects of
Q34: The market demand is the:
A) horizontal sum
Q35: At a price of $5, Sam buys
Q36: An increase in the demand for a
Q37: A fall in the price of a
Q38: A movement along a demand curve is
Q335: When economists say the quantity demanded of
Unlock this Answer For Free Now!
View this answer and more for free by performing one of the following actions

Scan the QR code to install the App and get 2 free unlocks

Unlock quizzes for free by uploading documents