Exhibit 3-3 Demand curves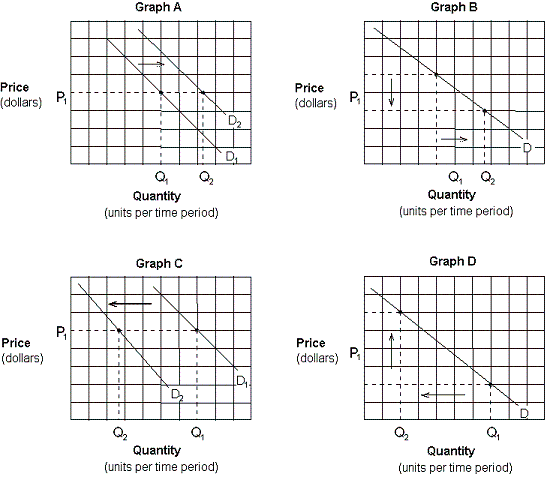
-Which of the graphs in Exhibit 3-3 depicts the effect of a decrease in the price of pizza on the demand curve for pizza?
A) Graph A.
B) Graph B
C) Graph C.
D) Graph D.
Correct Answer:
Verified
Q41: If the demand for a good decreases
Q42: Which of the following will not shift
Q43: Which of the following is true if
Q44: Exhibit 3-2 Demand curves Q45: Which of the following will increase the Q47: Ceteris paribus , which of the following Q48: When firms advertise their products, they are Q49: If consumer tastes are changing more in Q50: Assuming that generic brands are inferior goods, Q51: Which of the following must be true![]()
Unlock this Answer For Free Now!
View this answer and more for free by performing one of the following actions

Scan the QR code to install the App and get 2 free unlocks

Unlock quizzes for free by uploading documents