Exhibit 3-3 Demand curves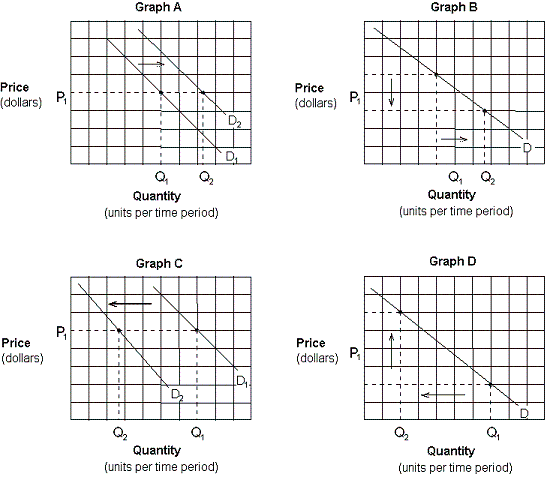
-Assume that consumers expect the price of gasoline to rise sharply in the future. Which of the graphs in Exhibit 3-3 depicts this effect?
A) Graph A.
B) Graph B.
C) Graph C.
D) Graph D.
Correct Answer:
Verified
Q70: According to the law of supply, there
Q71: Demand for a good will always rise
Q72: Which of the following states the definition
Q73: Tasha decides that when homes in her
Q74: In general, supply curves slope upward because:
A)
Q77: The law of supply states that:
A) there
Q78: Exhibit 3-3 Demand curves Q79: If a decrease in the price of Q80: Exhibit 3-3 Demand curves Q284: According to the law of supply,![]()
![]()
A) more
Unlock this Answer For Free Now!
View this answer and more for free by performing one of the following actions

Scan the QR code to install the App and get 2 free unlocks

Unlock quizzes for free by uploading documents