Exhibit 3-4 Supply curves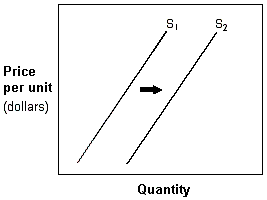
In Exhibit 3-4, a shift in the supply curve from S1 to S2 represents a(n) :
A) decrease in supply.
B) decrease in the quantity supplied.
C) increase in supply.
D) increase in the quantity supplied.
Correct Answer:
Verified
Q113: A decrease in the number of dry
Q114: If the United Auto Workers union can
Q115: A leftward shift of a supply curve
Q116: An improvement in a firm's technology that
Q117: If Congress decides to reduce the tax
Q119: Seller A has an upward-sloping supply curve
Q120: The most plausible reason why changes in
Q121: Which of the following is most likely
Q122: Which of the following would not cause
Q123: The price of a good will fall
Unlock this Answer For Free Now!
View this answer and more for free by performing one of the following actions

Scan the QR code to install the App and get 2 free unlocks

Unlock quizzes for free by uploading documents