Exhibit 4-3 Supply and demand curves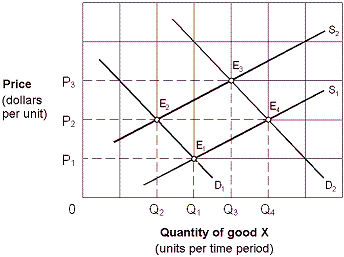
Initially the market shown in Exhibit 4-3 is in equilibrium at P2, Q2 (E2) . Changes in market conditions result in a new equilibrium at P2, Q4 (E4) . This change is stated as a(n) :
A) increase in supply and an increase in demand.
B) increase in supply and a decrease in demand.
C) decrease in demand and a decrease in supply.
D) increase in demand with supply held constant at S2.
Correct Answer:
Verified
Q35: Exhibit 4-3 Supply and demand curves
Q36: Exhibit 4-2 Supply and demand curves
Q37: Exhibit 4-6 Demand and supply curves
Q38: Ceteris paribus , if consumer tastes change
Q39: Exhibit 4-5 Supply and demand curves for
Q41: Exhibit 4-8 Demand and supply curves
Q42: Stuart tells his student government representative at
Q43: If the equilibrium price of bread is
Q44: If the equilibrium price of aspirin is
Q45: There was an extensive black market (illegal
Unlock this Answer For Free Now!
View this answer and more for free by performing one of the following actions

Scan the QR code to install the App and get 2 free unlocks

Unlock quizzes for free by uploading documents