Exhibit 4-8 Demand and supply curves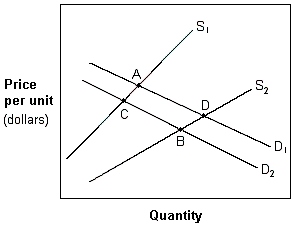
In Exhibit 4-8, a movement from A to D is best described as a(n) :
A) increase in the quantity demanded and an increase in supply.
B) increase in supply and demand.
C) increase in both the quantity demanded and supplied.
D) increase in the quantity supplied and in the demand.
Correct Answer:
Verified
Q49: An increase in demand and a decrease
Q50: If the equilibrium price of good X
Q52: Ceteris paribus , an increase in the
Q53: If the government imposes a price ceiling
Q55: Price ceilings set below the equilibrium create:
A)
Q56:


