Exhibit 4-8 Demand and supply curves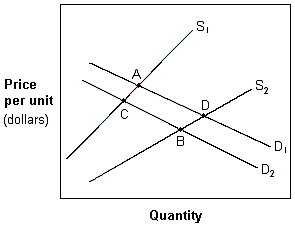
In Exhibit 4-8, a movement from A to B is best explained by:
A) an increase in income and in the number of suppliers.
B) an increase in the price of other goods.
C) an increase in the population.
D) a decrease in income if X is a normal good and an improvement in the technology used to produce the good.
Correct Answer:
Verified
Q36: Exhibit 4-2 Supply and demand curves
Q37: Exhibit 4-6 Demand and supply curves
Q38: Ceteris paribus , if consumer tastes change
Q39: Exhibit 4-5 Supply and demand curves for
Q40: Exhibit 4-3 Supply and demand curves
Q42: Stuart tells his student government representative at
Q43: If the equilibrium price of bread is
Q44: If the equilibrium price of aspirin is
Q45: There was an extensive black market (illegal
Q46: An increase in both supply and demand
Unlock this Answer For Free Now!
View this answer and more for free by performing one of the following actions

Scan the QR code to install the App and get 2 free unlocks

Unlock quizzes for free by uploading documents