Exhibit 5-1 Demand curve
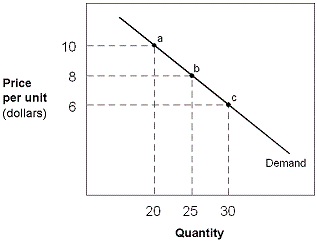
In Exhibit 5-1, between points b and c, the price elasticity of demand measures
A) 0.425.
B) 1.571.
C) 0.143
D) 0.636.
Correct Answer:
Verified
Q31: If the price elasticity of demand for
Q32: Exhibit 5-1 Demand curve Q33: Exhibit 5-2 Price and quantity demanded data Q34: If the quantity of bread demanded rises Q35: If Sam, the Pizza Man, lowers the Q37: If demand for a good is elastic, Q38: An economist estimates that the price elasticity Q39: Exhibit 5-1 Demand curve Q40: When a 2 percent increase in price Q41: As one moves down a straight-line, down-sloping
![]()
![]()
Unlock this Answer For Free Now!
View this answer and more for free by performing one of the following actions

Scan the QR code to install the App and get 2 free unlocks

Unlock quizzes for free by uploading documents