Exhibit 5-9 Supply and Demand Curves for Good X
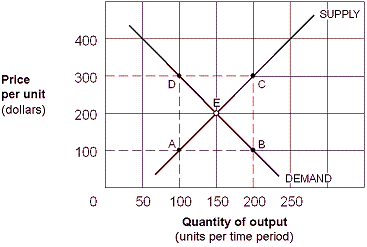
As shown in Exhibit 5-9, the price elasticity of demand for good X between points E and B is:
A) 3/7 = 0.43.
B) 7/3 = 2.33.
C) 1/2 = 0.50.
D) 1.
Correct Answer:
Verified
Q19: If the percentage change in the quantity
Q43: Any change in price along a perfectly
Q44: Suppose there is no change in total
Q45: Which of the following describes a situation
Q46: If a 5 percent decrease in the
Q47: Exhibit 5-4 Demand curves for silver

Q49: Suppose the president of a textbook publisher
Q50: What does the "price elasticity of demand"
Q51: Consider the market for bicycles. If a
Q53: If a good has a price elasticity
Unlock this Answer For Free Now!
View this answer and more for free by performing one of the following actions

Scan the QR code to install the App and get 2 free unlocks

Unlock quizzes for free by uploading documents