Exhibit 5-8 Supply and demand curves for good X
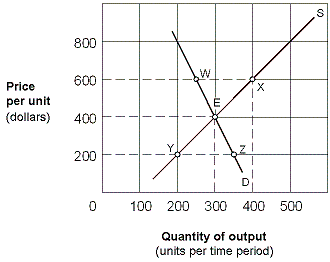
In Exhibit 5-8, the price elasticity of supply for good X between points Y and E is:
A) 1/5 = 0.20.
B) 5/3 = 1.66.
C) 3/5 = 0.60.
D) 1.
Correct Answer:
Verified
Q135: Exhibit 5-8 Supply and demand curves for
Q137: Suppose that the quantity of apples sold
Q138: If a tripling of price triples the
Q139: Suppose that when price is $10, quantity
Q141: Assuming the demand curve is more elastic
Q142: Exhibit 5-9 Supply and Demand Curves for
Q143: In a market with a downward-sloping demand
Q144: If an excise tax is placed on
Q145: To raise the most tax revenue, governments
Q182: If the federal government placed a 50
Unlock this Answer For Free Now!
View this answer and more for free by performing one of the following actions

Scan the QR code to install the App and get 2 free unlocks

Unlock quizzes for free by uploading documents