Exhibit 5-9 Supply and Demand Curves for Good X
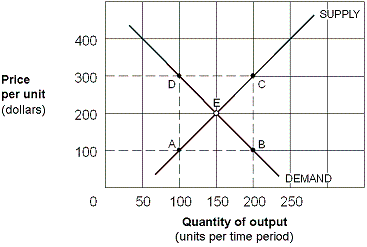
As shown in Exhibit 5-9, the $200 per unit tax on Good X raises tax revenue per time period totaling:
A) $10,000.
B) $20,000.
C) $30,000.
D) $60,000.
Correct Answer:
Verified
Q137: Suppose that the quantity of apples sold
Q138: If a tripling of price triples the
Q139: Suppose that when price is $10, quantity
Q140: Exhibit 5-8 Supply and demand curves for
Q141: Assuming the demand curve is more elastic
Q143: In a market with a downward-sloping demand
Q144: If an excise tax is placed on
Q145: To raise the most tax revenue, governments
Q146: Good A has a price elasticity of
Q147: Exhibit 5-9 Supply and Demand Curves for
Unlock this Answer For Free Now!
View this answer and more for free by performing one of the following actions

Scan the QR code to install the App and get 2 free unlocks

Unlock quizzes for free by uploading documents