Exhibit 7-15 Long-run average cost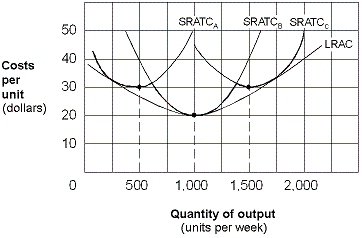
In Exhibit 7-15, diseconomies of scale are shown in the range of:
A) 0 to 500 units per week.
B) 500 to 1,000 units per week.
C) 1,000 to 2,000 units per week.
D) zero per week.
Correct Answer:
Verified
Q120: If a firm enlarges its factory size
Q121: Exhibit 7-16 Long-run average cost curves
Q122: Exhibit 7-15 Long-run average cost Q123: Exhibit 7-15 Long-run average cost Q124: Exhibit 7-14 Cost curves Q126: Exhibit 7-15 Long-run average cost Q127: Exhibit 7-14 Cost curves Q128: Exhibit 7-15 Long-run average cost Q129: Exhibit 7-16 Long-run average cost curves Q130: Exhibit 7-14 Cost curves Unlock this Answer For Free Now! View this answer and more for free by performing one of the following actions Scan the QR code to install the App and get 2 free unlocks Unlock quizzes for free by uploading documents![]()
![]()
![]()
![]()
![]()
![]()
![]()

