Exhibit 11-4 Supply and demand curves for food servers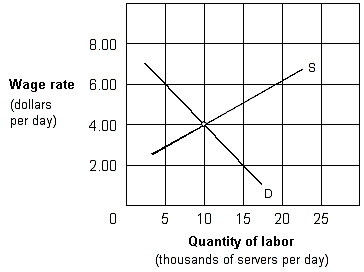
In Exhibit 11-4, the equilibrium wage and the number of food servers employed per day, respectively, are:
A) $2.00 and 5,000.
B) $4.00 and 10,000.
C) $6.00 and 15,000
D) $8.00 and 20,000.
Correct Answer:
Verified
Q12: Dividing the change in total revenue by
Q13: Exhibit 11-2 Labor and output data
Q14: Exhibit 11-1 Use the information in the
Q15: The marginal revenue product of a resource:
A)
Q16: If a product's price increases, then its:
A)
Q18: One reason the supply of carpenters is
Q20: A worker's accumulated investment in education, training,
Q21: A union may attempt to obtain stricter
Q101: Harold Brown runs a company that sells
Q136: Which of the following most clearly illustrates
Unlock this Answer For Free Now!
View this answer and more for free by performing one of the following actions

Scan the QR code to install the App and get 2 free unlocks

Unlock quizzes for free by uploading documents