Exhibit 12-1 Income distribution for three countries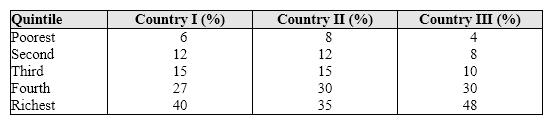
Exhibit 12-1 shows the percentage of income received by each population quintile. From this chart we can conclude:
A) Country I has the most unequal income distribution.
B) Country III has a more equal income distribution than Country II.
C) Country II has the most unequal income distribution.
D) Country II has the most equal income distribution.
Correct Answer:
Verified
Q15: "Dividing the economic pie more equally may
Q16: Exhibit 12-1 Income distribution for three countries
Q17: Exhibit 12-2 Lorenz curve Q18: The poverty line equals the: Q19: Of the following demographic groups, which has Q21: Because the benefits distributed under TANF and Q22: Which one of the following examples is Q23: Exhibit 12-7 Negative income tax Q24: What is the official definition of the Q25: Which of the following statements is correct![]()
A) average income![]()
Unlock this Answer For Free Now!
View this answer and more for free by performing one of the following actions

Scan the QR code to install the App and get 2 free unlocks

Unlock quizzes for free by uploading documents