Exhibit 8-1 Disposable income and consumption data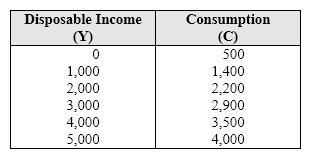
In Exhibit 8-1, when disposable income is increased from $2,000 to $3,000 to $4,000, the marginal propensity to consume
A) remains constant.
B) increases from 0.6 to 0.7.
C) decreases from 0.8 to 0.7.
D) decreases from 0.7 to 0.6.
Correct Answer:
Verified
Q51: Which of the following events would produce
Q52: What are the marginal propensity to consume
Q53: Explain why the marginal propensity to save
Q54: If your disposable personal income increases from
Q55: Exhibit 8-6 Consumption function Q57: Exhibit 8-8 Consumption function Q58: Exhibit 8-7 Consumption function Q59: Exhibit 8-2 Consumption function Q60: The marginal propensity to save is: Q61: Which one of the following will shift Unlock this Answer For Free Now! View this answer and more for free by performing one of the following actions Scan the QR code to install the App and get 2 free unlocks Unlock quizzes for free by uploading documents
![]()
![]()
![]()
![]()
A) the

