Exhibit 8-1 Disposable income and consumption data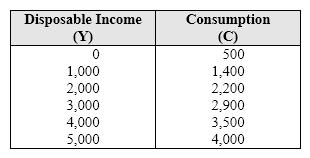
In Exhibit 8-1, when disposable income (Y) is increased from $0 to $1,000 to $2,000, the marginal propensity to consume:
A) is negative.
B) decreases from 0.9 to 0.8.
C) decreases from 0.8 to 0.7.
D) increases from 0.8 to 0.9.
Correct Answer:
Verified
Q41: Exhibit 8-2 Consumption function Q42: Exhibit 8-8 Consumption function Q43: Exhibit 8-2 Consumption function Q44: If the marginal propensity to consume = Q45: The sum of the marginal propensity to Q47: Exhibit 8-2 Consumption function Q48: Exhibit 8-6 Consumption function Q49: Exhibit 8-2 Consumption function Q50: Exhibit 8-7 Consumption function Q51: Which of the following events would produce Unlock this Answer For Free Now! View this answer and more for free by performing one of the following actions Scan the QR code to install the App and get 2 free unlocks Unlock quizzes for free by uploading documents![]()
![]()
![]()
![]()
![]()
![]()
![]()

