Exhibit 10-4 Aggregate supply and demand curves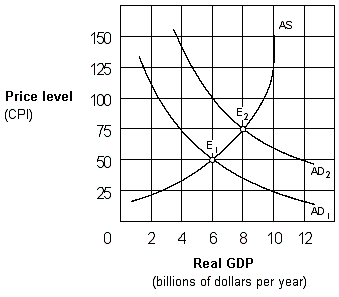
The increase in the price level as the economy moves from E1 to E2 in Exhibit 10-4 represents:
A) cost-push inflation.
B) demand-shock inflation.
C) wage push inflation.
D) demand-pull inflation.
Correct Answer:
Verified
Q80: Exhibit 10-6 Aggregate supply curve Q81: Which of the following events is the Q82: Lower taxes on businesses will shift the Q83: _ inflation can be explained by an Q84: How are demand-pull and cost-push inflation reflected Q86: When OPEC caused the price of oil Q87: Stagflation occurs when the economy experiences: Q88: A reduction in regulation will shift the Q89: Exhibit 10-8 Aggregate demand and supply Q90: Other factors held constant, a decrease in![]()
A) low
Unlock this Answer For Free Now!
View this answer and more for free by performing one of the following actions

Scan the QR code to install the App and get 2 free unlocks

Unlock quizzes for free by uploading documents