Exhibit 1A-9 Multi-curve graph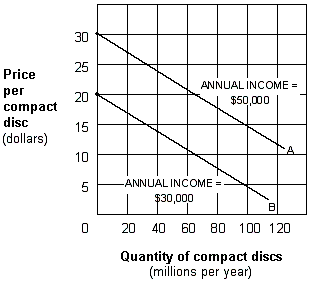
Exhibit 1A-9 represents a three-variable relationship. As the annual income of consumers falls from $50,000 (line A) to $30,000 (line B) , the result is a:
A) rightward movement along each curve.
B) leftward movement along each curve,.
C) leftward shift from curve A to curve B.
D) rightward shift from curve B to curve A.
Correct Answer:
Verified
Q34: Exhibit 1A-4 Straight line Q35: Which of the following is used to Q36: Exhibit 1A-7 Straight line relationship Q37: Exhibit 1A-8 Straight line relationship Q38: Suppose Sue's buys a good for $60 Q40: A shift in a curve represents a Q41: Producer surplus measures the value between the Q42: Using supply and demand curve analysis, the Q43: Suppose Gizmo Inc. is willing to sell Q44: Suppose a consumer is willing to pay Unlock this Answer For Free Now! View this answer and more for free by performing one of the following actions Scan the QR code to install the App and get 2 free unlocks Unlock quizzes for free by uploading documents![]()
![]()
![]()

